
Learning Math/CS/Engineering Design with Robotics
CSP Unit 3 Lesson 5.7
| Grid Size: S M L | Simple View: | MinView: |
|
|
|
| Coord: x-axis y-axis | Grid Lines: x-axis y-axis | |||
| Grid: | 12x12 inches | 24x24 inches | 36x36 inches | |
| 72x72 inches | 96x96 inches | 192x192 inches | ||
| 1x1 inches | 2x2 inches | Fraction: | ||
| xy-Range: | ||||
|
|
||||
|
|
||||
| Quad: | 1 Quadrant | 4 Quadrants | 1&4 Quadrants | |
| Units: | US Customary | Metric | Ruler: | |
| Labels: |
|
|
|
|
Font
px
|
|
| Tics Lines: |
|
Width
px
|
| Hash Lines: |
|
Width
px
|
1. Linkbot
|
(
,
in
) in
|
|
 degrees
|
|
Width
px
2. Linkbot
|
(
,
in
) in
|
|
|
degrees
|
|
Width
px
3. Linkbot
|
(
,
in
) in
|
|
|
degrees
|
|
Width
px
4. Linkbot
|
(
,
in
) in
|
|
|
degrees
|
|
Width
px
5. Linkbot
|
(
,
in
) in
|
|
|
degrees
|
|
Width
px
6. Linkbot
|
(
,
in
) in
|
|
|
degrees
|
|
Width
px
7. Linkbot
|
(
,
in
) in
|
|
|
degrees
|
|
Width
px
8. Linkbot
|
(
,
in
) in
|
|
|
degrees
|
|
Width
px
9. Linkbot
|
(
,
in
) in
|
|
|
degrees
|
|
Width
px
10. Linkbot
|
(
,
in
) in
|
|
|
degrees
|
|
Width
px
11. Linkbot
|
(
,
in
) in
|
|
|
degrees
|
|
Width
px
12. Linkbot
|
(
,
in
) in
|
|
|
degrees
|
|
Width
px
1. OmniBotA
|
(
,
in
) in
|
|
|
degrees
|
|
Width
px
2. OmniBotA
|
(
,
in
) in
|
|
|
degrees
|
|
Width
px
3. OmniBotA
|
(
,
in
) in
|
|
|
degrees
|
|
Width
px
4. OmniBotA
|
(
,
in
) in
|
|
|
degrees
|
|
Width
px
5. OmniBotA
|
(
,
in
) in
|
|
|
degrees
|
|
Width
px
6. OmniBotA
|
(
,
in
) in
|
|
|
degrees
|
|
Width
px
|
|
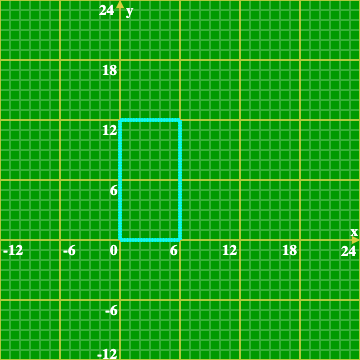
Once we define a function, we can use it within other functions that we create. For example, it would be nice to have a "drawRectangle" function. To create one, take the code that draws a rectangle (as shown), which includes the traceOn, driveDistance, "right", and traceOff commands, and move it into a new function named drawRectangle using the pre-placed function block. Then add code that calls the drawRectangle function at the beginning of the program (after traceColor). Note that the function definition for "right" is pre-placed at the end for you. |
|
Pre-Board Workspace
|
|||||||||||

Post-Board Workspace
|
|||||||||||